After living in 26 states, I chose Denver. Good relocation guidance is not a list of city names—it connects budget, commute, housing, taxes, property risks, and the life you actually want.
Start with the payment—not the list price
Two buyers with the same price ceiling may have very different workable budgets once interest rate, down payment, taxes, insurance, HOA dues, metro-district debt, and maintenance are included. Use the bands below as search-planning ranges, not promises of inventory.
Around $400K
Expect the widest selection among condos, townhomes, attached homes, smaller or older houses, and locations farther from the urban core. Search Aurora, Thornton, Northglenn, Commerce City, parts of Westminster, and selected Denver neighborhoods—but compare HOA dues, insurance, condition, commute, and resale restrictions property by property.
Around $500K–$600K
The search can expand to more detached homes and a broader mix of established suburbs, including parts of Arvada, Lakewood, Centennial, Littleton, Parker, Broomfield, and south or east Aurora. A newer home may carry higher district taxes; an older home may require more near-term systems work.
$800K and above
Buyers gain more choices in central Denver, larger-lot suburbs, foothill-adjacent communities, premium school-district locations, and newer homes with upgraded space. The higher price does not remove due diligence: wildfire exposure, insurance, drainage, soil, HOA rules, renovation history, and commute remain address-specific.
Build a flexible search
Choose two or three priorities you will not trade away—perhaps commute, detached housing, yard size, or monthly payment—then keep geography or finish level flexible. Connect this guide to the neighborhood finder and live brokerage inventory before deciding where a budget ‘should’ buy.
2026 Denver metro median sale-price map
The updated visual uses Redfin three-month median sale prices through June 2026 for all home types, rounded to $1,000; Englewood is through May 2026. Citywide medians help frame a budget but do not price a neighborhood, property type, or individual home.
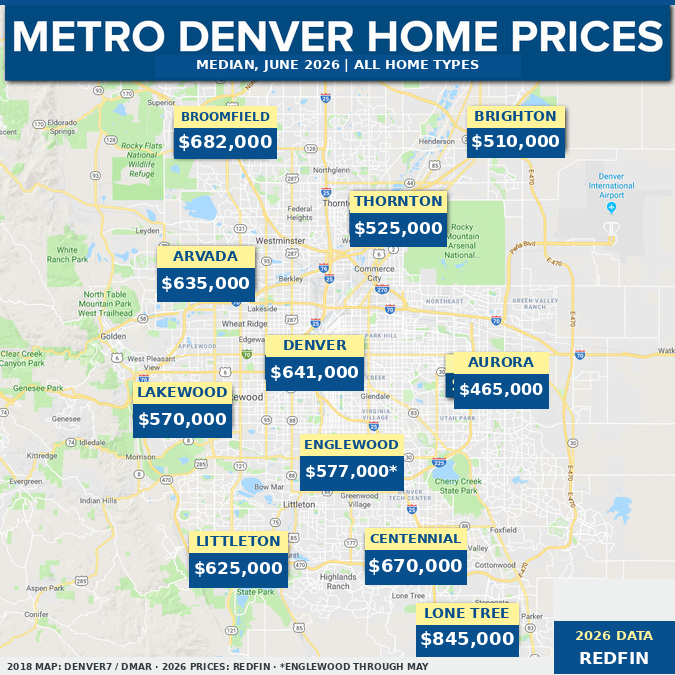
Compared with Denver7’s original 2018 graphic
Denver7’s older graphic used DMAR detached-home medians as of July 18, 2018. Because the 2018 graphic covers detached homes while the 2026 map includes all home types, use them to compare price scale—not to calculate a precise appreciation rate.
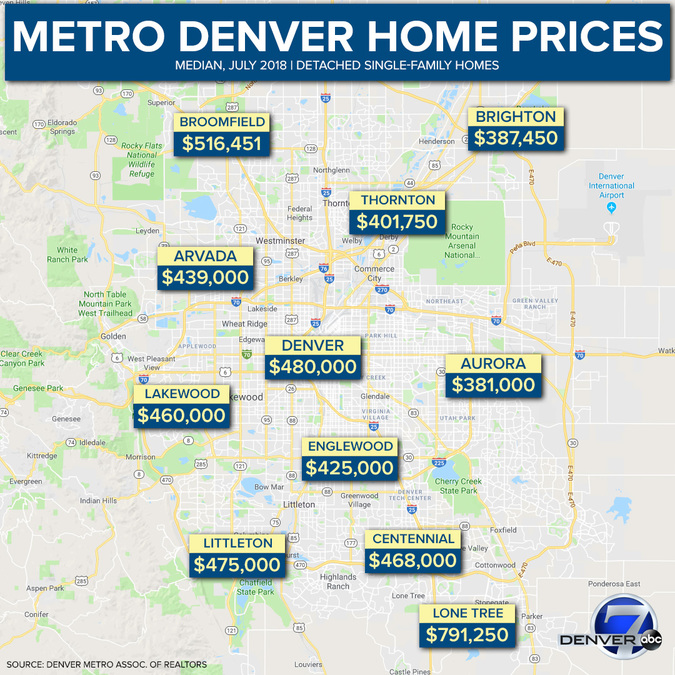
City by city: 2026 and 2018
Increase is calculated directly from the displayed 2026 and 2018 medians. Because the property-type methodology differs, it is a directional comparison—not a precise like-for-like appreciation rate.